Cohort Summary Statistics
The Basics
The Airwave Tissue Bank is an epidemiological study of police officers and staff in Britain. It is managed and run by the Department of Epidemiology & Biostatistics at Imperial College London, and we believe it to be the only large-scale cohort study of police employees anywhere in the world.
Jump to:
- Assets
- Biological Samples (blood, urine, DNA etc)
- Descriptive Statistics
- Age/Sex at Baseline
- Ethnicity & Location
- Clinical and Biological Measurements
- Education, Marital Status, Rank & Smoking
- Intervals Between Follow-up Screening Visits
The cohort has been richly phenotyped, flagged to routine records, and has a substantial biobank of blood and urine samples. It provides an excellent and unique resource to study the genetic, metabolic, occupational and lifestyle factors associated with mental health and cognitive performance among a predominantly male and young adult workforce with a well-defined organisational hierarchy.
The cohort was established in 2004 to investigate possible long-term health effects associated with use of TETRA, the radio system used by the police service. Mean age at recruitment was 39.8 y (σ = 16.0) and ranged from 16 - 80 y. The mean duration of follow-up at January 2025 is 15.2 y (σ = 2.9). It includes a group – younger men aged between twenty and forty years – who are particularly under-represented in the UK research portfolio, who have proven hard to engage in primary prevention, and have least routine contact with primary care. Some further statistics on the cohort are set out in the table below.
Recruitment was completed in 2015, and over the next four years a series of papers were published to evaluate the effect of TETRA on health. Whilst our overall assessment was that insufficient time has passed to form any final conclusions, we continue to follow-up the cohort through national registers, via follow-up screening and self-administered surveys.
We have also successfully re-purposed the cohort to support broader research goals into common diseases affecting this well-defined occupational group. For example, the cohort made a significant contribution to COVID-19 research, by providing 5985 volunteers for studies into novel methods for diagnosis of SARS-CoV-2 infection. We are core members of Dementia Platform UK (DPUK), UK Longitudinal Linkage Collaboration, and are listed on eight other directories supporting researchers worldwide.
Researchers can apply to our Access Committee for access to samples and data in order to carry out their own research projects. As members of the DPUK public-private partnership, researchers can build a virtual cohort of participants from the many cohorts registered with DPUK. Participants can be selected from their genotype and / or phenotype, and participants may be invited to join researchers' own projects or clinical trials.
Summary of Assets
Asset | N (participants) |
| Participants, net of withdrawals | 53,244 |
| Clinic-based measurements – baseline | 45,594 |
| Clinic-based measurements – follow-up | 18,317 |
| Cognitive first assessment | 37,122 |
| Cognitive follow-up assessment | 11,489 |
| 7-day food diaries – baseline | 23,388 |
| 7-day food diaries – follow-up | 11,626 |
| Sickness absence (HR departments) | 32,102 |
| Estimated TETRA usage | 48,518 |
| ECGs – baseline | 45,381 |
| ECGs – follow-up | 15,832 |
| GWAS | 20,193 |
| Exome array | 1,947 |
| Methylation array | 920 |
| Metabolomics (NMR, mass spectrometry) | 6,242 |
| Blood, urine & DNA samples | 45,655 |
| Proteomics | 4,972 |
Biological Samples
When participants attend clinics, we generally collect a sample of blood and urine in a variety of collection tubes. Following biochemistry and haematology assays, which are carried out generally within 24-hours, we store the remaining material in cryogenic conditions for more detailed assays at a later date. These have included genetic and metabolomic assays, with proteomics planned.
The following is a summary of the biological material available according to our inventories as of March 2026. We are currently conducting a stock-take and rationalization of the collection and the numbers presented here will change over the course of 2026. If you are interested in making use of the samples, please contact us.
| Collection Tube | Material | Aliquots | Baseline | Follow-Up | Participants | Boxes | Collected From | Collected Till |
| ACD | Lymphocytes | 107,216 | 30,870 | 6,936 | 32,579 | 790 | Aug 2008 | Mar 2020 |
| Card | Dry Blood Spot | 5,114 | 1 | 5,112 | 5,112 | 80 | May 2012 | Jul 2020 |
| EDTA | DNA | 38,240 | 20,424 | 100 | 20,366 | 476 | Jul 2006 | Nov 2016 |
| Plasma | 123,696 | 44,889 | 21,844 | 45,045 | 13,515 | Jul 2004 | Aug 2023 | |
| Red Blood Cells | 92,426 | 34,339 | 16,158 | 37,194 | 9,458 | Jul 2004 | Feb 2021 | |
| White Blood Cells | 46,646 | 25,120 | 20,972 | 33,687 | 9,958 | Jul 2004 | Feb 2021 | |
| Whole Blood | 7,188 | - | 1,520 | 1,520 | 288 | Jan 2021 | Aug 2023 | |
| Lithium Heparin | Plasma | 106,884 | 43,074 | 15,897 | 43,155 | 12,311 | Jul 2004 | Aug 2023 |
| Red Blood Cells | 39,721 | 16,626 | - | 16,273 | 3,469 | Jul 2004 | Nov 2009 | |
| White Blood Cells | 36,392 | 32,998 | 2 | 32,410 | 6,996 | Jul 2004 | Jul 2016 | |
| Swab | Nasal Mucus | 5,173 | - | 5,173 | 5,172 | 1 | Jun 2020 | Jul 2020 |
| Sodium Citrate | Plasma | 47,703 | 43,963 | 2 | 43,134 | 9,233 | Jul 2004 | Jul 2016 |
| Red Blood Cells | 19,976 | 16,656 | - | 16,301 | 3,481 | Jul 2004 | Nov 2009 | |
| White Blood Cells | 47,164 | 43,547 | - | 42,740 | 9,161 | Jul 2004 | Mar 2015 | |
| SST | Serum | 194,524 | 44,850 | 21,916 | 44,458 | 12,454 | Jul 2004 | Aug 2023 |
| Salivabio Kit | Saliva | 787 | - | 784 | 784 | 10 | Jan 2021 | Feb 2021 |
| Tempus Tube | RNA | 281 | 156 | 7 | 161 | 7 | Dec 2006 | Feb 2020 |
| Whole Blood | 50,065 | 4,701 | 21,771 | 22,327 | 3,265 | Nov 2012 | Aug 2023 | |
| Pot | Urine | 190,352 | 41,277 | 14,359 | 41,377 | 10,864 | Jul 2004 | Aug 2023 |
Descriptive Statistics
In the tables below, participants with no information on gender (N=17) are excluded. Means (SD) are presented for age and percentages are presented for all other variables; n refers to the number of participants for whom each variable is available.
Means (SD) and percentages are presented for continuous and categorical variables respectively; n refers to the number of participants for whom each variable is available. The following definitions apply:
- SBP: systolic blood pressure.
- DBP: diastolic blood pressure.
- HbA1c: glycosylated haemoglobin.
- GCSE: General Certificate of Secondary Education (usually taken at 16-years)
- Hypertension is defined as systolic blood pressure > 140 mmHg or diastolic blood pressure > 90 mmHg.
Demographics
| Metric | Women | Men | Total |
| N (%) | 19,567 (36.8) | 33,661 (63.3) | 53,228 |
| Age (years) (n = 53,167) | 38.5 (9.4) | 40.6 (8.9) | 39.8 (9.1) |
| Marital status (%) (n = 40,889) | |||
| Married | 46.7 | 68.6 | 60.5 |
| Cohabiting | 20.8 | 15.1 | 17.2 |
| Single | 18.7 | 7.8 | 11.9 |
| Divorced/separated | 10.3 | 6.8 | 8.1 |
| Other | 3.4 | 1.7 | 2.3 |
| White (n = 38,725) | 95 | 94.6 | 94.8 |
| Black (n = 441) | 1.5 | 0.8 | 1.1 |
| South Asian (n = 547) | 1.3 | 1.4 | 1.3 |
| Mixed (n = 454) | 1.1 | 1.1 | 1.1 |
| Other (n = 699) | 1.1 | 2 | 1.7 |
| Education (%) (n = 40,889) | |||
| Left school before taking GCSEs | 3.3 | 4 | 3.8 |
| GCSE or equivalent | 27.6 | 31.1 | 29.8 |
| Vocational qualification | 7.1 | 7 | 7 |
| A-levels or equivalent | 31.1 | 32.1 | 31.7 |
| Bachelor degree or equivalent | 23.1 | 20.1 | 21.2 |
| Postgraduate qualifications | 7.9 | 5.7 | 6.5 |
| Rank (%) (n = 37,251) | |||
| Police staff | 47.5 | 16.4 | 27.9 |
| Police Constable/Sergeant | 46.6 | 72 | 62.6 |
| Inspector/Chief Inspector | 3.3 | 10 | 7.5 |
| Other | 2.7 | 1.6 | 2 |
| Smoking status (%) (n = 41,345) | |||
| Non-smoker | 65.2 | 68.5 | 67.3 |
| Past smoker | 22.7 | 23 | 22.9 |
| Current smoker | 12.1 | 8.5 | 9.8 |
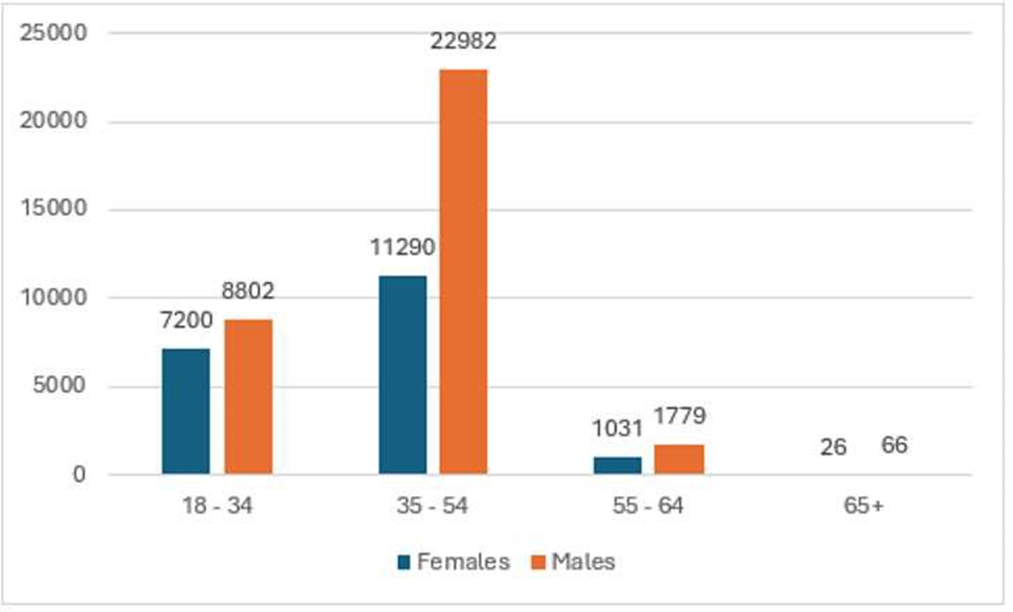
Age-Sex Distribution at Baseline
Mean age at recruitment was 39.8 (s.d. 9.1; range 16 to 80) years; mean duration of follow-up to date is 13.8 (s.d. 2.9) years.
Ethnicity and Location
For those with ethnicity data, 94.8% self-report as white, 1.3% South Asian, 1.1% Black, 1.1% mixed ethnicity, 1.7% other, reflecting the demography of the police force at that time. 70% of the cohort were recruited in England, 15% in Scotland and 15% in Wales.
Clinical and Biological Measurements
| Metric | Women | Men | Total |
| N (%) | 17,059 (36.9%) | 29,165 (63.1%) | 46,224 |
| BMI (kg/m2) (n = 45,471) | 26.0 (4.7) | 28.0 (3.7) | 27.2 (4.2) |
| BMI < 25 kg/m2 (%) | 49.3 | 20.5 | 31.1 |
| 25 kg/m2 < BMI < 30 kg/m2 (%) | 33.8 | 54.4 | 46.8 |
| BMI > 30 kg/m2 (%) | 16.9 | 25.1 | 22.1 |
| SBP (mmHg) (n = 45,483) | 122.2 (14.1) | 134.8 (13.7) | 130.1 (15.1) |
| DBP (mmHg) (n = 45,483) | 76.1 (9.5) | 81.2 (9.9) | 79.3 (10.1) |
| Hypertension | 12.9 | 34.9 | 26.8 |
| Total cholesterol (mmol/l) (n = 45,186) | 5.1 (1.0) | 5.4 (1.1) | 5.3 (1.0) |
| Total cholesterol > 5 mmol/l | 53.5 | 64.7 | 60.6 |
| HbA1c % (n = 45,019) | 5.6 (0.6) | 5.6 (0.6) | 5.6 (0.6) |
| HbA1c % < 6 (%) | 81.2 | 85.5 | 83.9 |
| 6 < HbA1c % < 6.5 (%) | 14.9 | 11.4 | 12.7 |
| HbA1c % > 6.5 (%) | 3.9 | 3.1 | 3.4 |
| Self-reported diabetes diagnosis (n = 41,100) (%) | 0.8 | 1 | 0.9 |
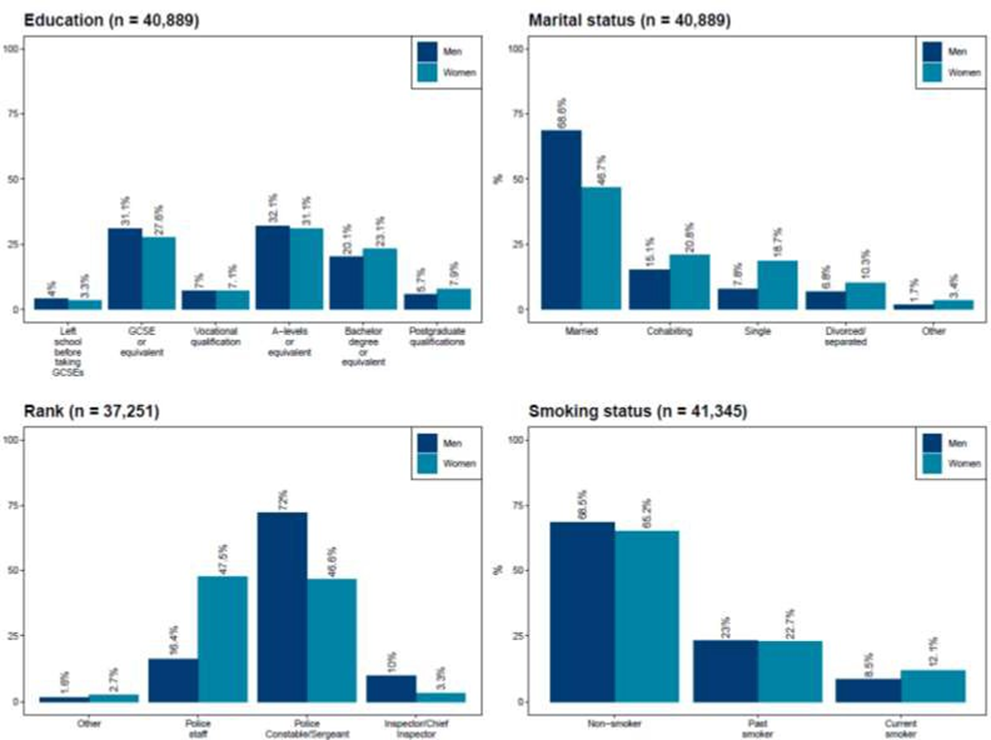
Education, Marital Status, Rank & Smoking
The graph below is for men and women across categories by education, marital status, rank and smoking among participants who attended a clinic visit at baseline.
Intervals Between Follow-up Screening Visits
The following table shows some descriptive statistics on the intervals (years) between successive follow-up screens.
| Visit | Shortest | Median | Longest | Mean | Std Dev. | N |
|---|---|---|---|---|---|---|
| 2 | 0.03 | 8.03 | 17.63 | 8.08 | 3.47 | 18,261 |
| 3 | 0.07 | 3.89 | 15.84 | 3.65 | 2.43 | 3,323 |
| 4 | 0.04 | 1.78 | 10.67 | 2.13 | 1.80 | 434 |
| 5 | 0.26 | 0.64 | 4.48 | 1.41 | 1.39 | 41 |
| 6 | 0.61 | 0.61 | 0.61 | 0.61 | - | 1 |